

MD&A · 2025
In this section4 topics
Overview of Operations
Overview of Operations
In 2025, the Company reported total revenue from sales and services of THB 113,477.8 million, a slight decrease of 0.8% from the previous year. Natural rubber sales volume reached 1,415,715 tonnes, up 0.1% year-on-year, while rubber glove sales volume stood at 37,102 million pieces, a decrease of 3.8% compared to the prior year. Throughout 2025, the Company operated amidst global economic volatility and challenges within the natural rubber industry. A significant factor was the announcement of US Reciprocal Tariff measures, which triggered a rapid decline in global rubber prices by more than 20%. This situation pressured average selling prices (ASP) to drop faster than raw material costs. Furthermore, the Company incurred non-recurring expenses, particularly in the fourth quarter of 2025, due to flooding in Hat Yai District, Songkhla Province. This event primarily affected several rubber glove manufacturing facilities, leading to a slowdown in performance. Consequently, the Company reported a net loss attributable to owners of the parent of THB 1,265.7 million, a reversal from a net profit of THB 1,670.4 million in the previous year. Despite these challenges, the Company maintains a strong financial position, with a Net Debt-to-Equity (Net D/E) ratio of only
0.6 times as of the end of 2025.
Performance Overview
Statement of Comprehensive Income (Million Baht) | 12M25 | 12M24 | %YoY |
Revenue from Sales and Services | 113,477.8 | 114,373.7 | -0.8% |
Cost of Sales and Services | (106,398.4) | (103,552.3) | 2.7% |
Gross Profit | 7,079.5 | 10,821.3 | -34.6% |
Selling and Administrative Expenses | (8,225.7) | (7,973.5) | 3.2% |
Other Income, including Dividend Income | 327.2 | 706.5 | -53.7% |
Gain (Loss) on Foreign Exchange | (487.8) | 288.0 | -269.4% |
Other Gains (Losses) | 582.0 | (284.7) | NM |
Operating Profit | (724.8) | 3,557.6 | -120.4% |
Share of Profit (Loss) from Associates and JVs | 88.5 | 99.4 | -11.0% |
EBITDA | 4,048.7 | 7,754.3 | -47.8% |
EBIT | (636.4) | 3,657.1 | -117.4% |
Financial Income | 234.5 | 407.7 | -42.5% |
Financial Costs | (1,512.3) | (1,721.4) | -12.1% |
Income Tax Expense | 508.2 | (163.1) | NM |
Profit (Loss) for the Period | (1,406.0) | 2,180.3 | -164.5% |
Owners of the Parent | (1,265.7) | 1,670.4 | -175.8% |
Non-controlling Interests | 140.3 | 509.9 | -127.5% |
Operating Results & Financial Condition
Operating Results & Profitability
Revenue by Product (Million Baht)
2025 | 2024 | % YoY | |
Technically Specified Rubber (TSR)* | 82,310.3 | 82,925.8 | -0.7% |
% | 72.5% | 72.5% | |
Rubber Glove* | 23,778.8 | 24,784.8 | -4.1% |
% | 21.0% | 21.7% | |
Ribbed Smoked Sheet (RSS) | 6,382.6 | 6,220.7 | 2.6% |
% | 5.6% | 5.4% | |
Concentrated Latex** | 925.0 | 316.4 | 192.3% |
% | 0.8% | 0.3% | |
Others*** | 81.1 | 125.9 | -35.6% |
% | 0.1% | 0.1% | |
Total Revenue | 113,477.8 | 114,373.7 | -0.8% |
Notes:
* evenue from TSR (Technically Specified Rubber) and Rubber Gloves is net of hedge accounting.
** The increase in latex sales within the Group is considered an intercompany transaction and is therefore not reflected in the Company’s consolidated financial statements.
*** Consists of revenue from certain services (e.g., logistics, research and development, and information technology) provided to the Company’s associates, joint ventures, and other external parties. Revenue from the natural rubber business comprises revenue from TSR, RSS (Ribbed Smoked Sheet), and concentrated latex products.
Revenue
In 2025, the Company’s revenue from sales and services amounted to THB 113,477.8 million, a slight decrease of 0.8% YoY. Natural rubber revenue accounted for THB 89,617.9 million, or 79.0% of total revenue, representing a marginal increase of 0.2% YoY. Although the average selling price (ASP) and sales volume both edged up by 0.1% YoY, the business faced pressure from global economic tensions, such as the US Reciprocal Tariff policy. This caused selling prices to decline faster than raw material costs. Meanwhile, rubber glove revenue in 2025 was THB 23,778.8 million, down 4.1% YoY, driven by a 3.8% YoY decline in sales volume and a 0.8% YoY decrease in ASP due to intensified industry competition.
Sales Volume
Natural Rubber Products
Sales volume in 2025 reached 1,415,715 tonnes, an increase of 0.1% compared to the previous year, despite global economic volatility and uncertainty in trade policies, particularly the US Reciprocal Tariff. Out of this total, 200,303 tonnes (or 14.1% of total sales volume) were EUDR-compliant rubber products, a significant increase of 50.4% from the prior year. This reflects the Company’s readiness to meet sustainability standards and evolving customer demands.
Rubber Glove Products
Sales volume in 2025 was 37,102 million pieces, a slight decrease of 3.8% from the previous year. The Company managed to maintain sales levels amid ongoing price competition and tariff uncertainties from US trade measures, which caused some customers to temporarily defer orders. Additionally, flooding in Hat Yai District, Songkhla Province—the location of several glove factories—impacted production during the end of the year. However, the Company successfully managed and restored operations appropriately.
Gross Profit
Gross profit in 2025 was THB 7,079.5 million, a decrease of 34.6% from the previous year, resulting in a gross profit margin of 6.2% (down from 9.5% in the prior year).
For the natural rubber business, the gross profit margin stood at 5.3%, as rubber prices declined due to concerns over US reciprocal tariffs while the cost of goods sold (COGS) decreased at a slower pace.
The rubber glove business saw its gross profit margin increase from 8.7% to 9.1%, as the reduction in COGS outpaced the decline in revenue, supported by lower raw material prices.
EBITDA
EBITDA in 2025 was THB 4,048.7 million, decreasing 47.8% YoY. Consequently, the EBITDA margin fell to 3.6% from 6.8% in the previous year.
Selling and Administrative Expenses (SG&A)
In 2025, SG&A expenses totaled THB 8,225.7 million, an increase of 3.2% from the prior year. This resulted in an SG&A-to-sales ratio of 7.2%, which remained close to the previous year’s level.
Share of Profit from Investments in Associates and Joint Ventures
The share of profit from investments in associates and joint ventures in 2025 was THB 88.5 million, a decrease of 11.0% from the previous year, primarily derived from the high-pressure hydraulic hose business.
Net Loss
Net loss attributable to the owners of the parent company for 2025 was THB 1,265.7 million, representing a net loss margin of 1.1%. This was a reversal from a net profit of THB 1,670.4 million in the previous year.
Liquidity & Capital Adequacy
Capital Expenditures (CAPEX) and Sources of Funds
In 2025, the Company’s capital expenditures (CAPEX) totaled THB 2,086.0 million, representing a 19.0% decrease from 2024. This was primarily because the Company’s production capacity expansion projects were largely completed during 2022–2023 and the 2025 period. CAPEX in 2025 was mainly allocated to the installation of solar PV systems, as well as technology and digital system developments—such as the "SRI TRANG FRIENDS" application and the "Super Driver" system. These expenditures also covered the maintenance of TSR (Technically Specified Rubber), RSS (Ribbed Smoked Sheet), and concentrated latex factories, as well as rubber glove facilities and various AI projects to enhance operational efficiency. The Company utilized internal cash flows and loans from financial institutions as the primary sources of funds for these investments.
Research and Development (R&D) Expenditures
In 2025, the Company’s R&D expenditures amounted to THB 103.4 million, covering all product segments including natural rubber and rubber gloves. The Company’s research and development efforts were focused on enhancing the potential of production processes and improving product quality to meet customer demands and support sustainable environmental management. Further details regarding R&D activities are disclosed in the Annual Registration Statement / Annual Report (Form 56-1 One Report), Chapter 1: "Business Structure and Operation," under the "1.2.2.1 Product/service information and business innovation development" section.
Asset Management Capability
Assets
As of December 31, 2025, total assets stood at THB 113,764.8 million, representing a 13.3% decrease from the end of 2024.
Current Assets
Current assets as of the end of 2025 amounted to THB 48,695.0 million, accounting for 42.8% of total assets. This reflects a decrease of THB 15,889.3 million, or 24.6%, from the previous year-end. The primary factors were a decrease in inventories, coupled with a reduction in cash and cash equivalents.
Non-current Assets
Non-current assets as of the end of 2025 totaled THB 65,069.8 million, representing 57.2% of total assets. This was a decrease of THB 1,553.7 million, or 2.3%, from the previous year-end, mainly due to the decrease in property, plant, and equipment resulting from depreciation.
Liabilities
As of December 31, 2025, the Company and its subsidiaries had total liabilities of THB 47,559.4 million, a 22.7% decrease from the end of 2024.
Current Liabilities
Current liabilities as of the end of 2025 were THB 25,308.4 million, accounting for 53.2% of total liabilities. This was a decrease of THB 14,451.9 million, or 36.3%, from the end of the previous year, primarily driven by a reduction in short-term loans from financial institutions and debentures.
Non-current Liabilities
Non-current liabilities as of the end of 2025 amounted to THB 22,251.0 million, representing 46.8% of total liabilities. This reflects an increase of THB 498.8 million, or 2.3%, from the previous year-end, primarily due to an increase in long-term loans from financial institutions.
Shareholders’ Equity
Shareholders’ equity as of the end of 2025 was THB 66,205.3 million, a decrease of THB 3,489.9 million, or 5.0%, from the end of the previous year, in line with the Company’s operating results.
Debt Obligations & Off-Balance-Sheet Management
Debt Servicing Capability and Compliance with Financial Covenants
As of December 31, 2025, the Company’s interest-bearing liabilities comprising short-term and long-term borrowings from financial institutions, debentures, and lease liabilities totaled THB 41,780.9 million (refer to Note 20 of the Financial Statements for details on maturities, interest rates, and currency exposure). Under the terms of the long-term loan agreements and debentures, the Company is required to maintain a Net Debt to Equity ratio of not more than 3:1 on a consolidated basis. The Company has remained in full compliance with these financial covenants throughout the reporting period.
Credit Policy
Sri Trang Agro-Industry Public Company Limited (the "Company") has established criteria for managing trade credit (Credit Term) and the average collection period, setting a limit not exceeding 40 days. These criteria serve as guidelines for monitoring and controlling credit risk at a level acceptable to the Company, while simultaneously maintaining and fostering strong customer relationships to ensure long-term business sustainability. In 2025, the Company’s collection period was 33 days, which is well within the established policy limit.
Other Analysis
| Title | Description | ||||||||||||||||||||||||||||||||||||||||||||||||||||||||||||||||||||||||||||||||||||||||||||||||||||||||||||||||||||||||||||||||||||||||||||||||||||||||||||||||||||||||||
|---|---|---|---|---|---|---|---|---|---|---|---|---|---|---|---|---|---|---|---|---|---|---|---|---|---|---|---|---|---|---|---|---|---|---|---|---|---|---|---|---|---|---|---|---|---|---|---|---|---|---|---|---|---|---|---|---|---|---|---|---|---|---|---|---|---|---|---|---|---|---|---|---|---|---|---|---|---|---|---|---|---|---|---|---|---|---|---|---|---|---|---|---|---|---|---|---|---|---|---|---|---|---|---|---|---|---|---|---|---|---|---|---|---|---|---|---|---|---|---|---|---|---|---|---|---|---|---|---|---|---|---|---|---|---|---|---|---|---|---|---|---|---|---|---|---|---|---|---|---|---|---|---|---|---|---|---|---|---|---|---|---|---|---|---|---|---|---|---|---|---|---|
| Key Financial Ratios | Current Ratio The current ratio is calculated by dividing total current assets by total current liabilities. As of December 31, 2024, and December 31, 2025, the Company’s current ratios were 1.62 times and 1.92 times, respectively. The increase in the current ratio was primarily due to a decrease in short-term loans from financial institutions at a rate higher than the decrease in current assets. Fixed Asset Turnover Ratio The fixed asset turnover ratio is calculated by dividing sales by the average value of property, plant, and equipment (net). As of December 31, 2024, and December 31, 2025, the Company’s fixed asset turnover ratios were 2.21 times and 2.29 times, respectively. The increase in the fixed asset turnover ratio was mainly attributed to the decrease in fixed assets resulting from depreciation and amortization. Return on Assets (ROA) Return on assets is calculated by dividing net profit (attributable to the parent company) by average total assets. As of December 31, 2024, and December 31, 2025, the Company’s ROA was 1.38% and (0.33)%, respectively. This decline was consistent with the Company's overall business performance. Return on Equity (ROE) Return on equity is calculated by dividing net profit (attributable to the parent company) by average total equity. As of December 31, 2024, and December 31, 2025, the Company’s ROE was 2.42% and (2.55)%, respectively, which fluctuated in line with the Company’s operating results. Debt to Equity Ratio (D/E) The debt to equity ratio is calculated by dividing total liabilities by total shareholders' equity. As of December 31, 2024, and December 31, 2025, the Company’s D/E ratios were 0.88 times and 0.72 times, respectively. The decrease in this ratio was primarily driven by the reduction in short-term loans from financial institutions. Summary of Key Financial Ratios
Notes: 1Calculated as Revenue from Sales and Services divided by average Trade Accounts Receivable. 2Calculated as Cost of Sales and Services divided by average Inventory. 3Calculated as Cost of Sales and Services divided by average Trade Accounts Payable. 4Calculated as Net Profit attributable to owners of the parent divided by average Total Shareholders' Equity. 5Calculated as Net Profit attributable to owners of the parent divided by average Total Assets. 6Calculated as the sum of Net Profit attributable to owners of the parent and Depreciation, divided by average Fixed Assets. 7Calculated as Revenue from Sales and Services divided by average Fixed Assets. 8Calculated as Total Revenue divided by average Total Assets. 9Calculated as Net Debt (Total Interest-Bearing Debt excluding lease liabilities as per the consolidated financial statements, less Cash, Cash Equivalents, and Short-term Investments) divided by Total Shareholders' Equity. | ||||||||||||||||||||||||||||||||||||||||||||||||||||||||||||||||||||||||||||||||||||||||||||||||||||||||||||||||||||||||||||||||||||||||||||||||||||||||||||||||||||||||||
| ESG Performance in 2025 | Environmental Aspect In 2025, the Company continued to advance its environmental initiatives under its commitment to achieve Net Zero Emissions by 2050. The Company places emphasis on tangible greenhouse gas reduction efforts while strengthening operational standards across the value chain to meet stakeholder expectations and evolving international trade frameworks that increasingly prioritize sustainability. The Company has focused on increasing the share of clean energy consumption through the continued expansion of solar power generation systems across multiple manufacturing facilities nationwide. As of the end of 2025, the Sri Trang Group had a total installed solar power generation capacity of 42.49 megawatts. This investment reduces reliance on fossil fuels, lowers greenhouse gas emissions, supports long term energy cost management, and enhances competitiveness in global markets where demand for environmentally friendly products continues to grow. In parallel, the Company has transitioned from diesel and LPG powered forklifts to electric forklifts to further support emission reduction and improve energy efficiency. In 2025, electric forklifts accounted for 84 percent of total forklift usage, representing a significant increase from 36 percent in the previous year. This demonstrates continued progress in improving energy efficiency and environmentally responsible operations. The Company has also strengthened its greenhouse gas management framework by registering and obtaining third party verification of its organizational carbon footprint report, covering Scope 1, Scope 2, and Scope 3 emissions. This reflects the Company’s systematic and transparent approach to emissions management in alignment with international standards. The assessment serves as a foundation for evaluating climate related risks and establishing future emission reduction pathways. In addition, the Company implemented the “Waste Bank” initiative across 29 factories and affiliated companies to reduce waste generation and operational emissions. The Company also participated in the Low Emission Support Scheme administered by the Thailand Greenhouse Gas Management Organization in a concrete and measurable manner. In terms of external recognition, the Company received certification under the SDGs for Climate X Program from the National Innovation Agency and was awarded Green Industry Level 4 by the Ministry of Industry. These recognitions reflect the Company’s commitment to environmental management, continuous process improvement, and long term emission reduction goals. Furthermore, the Company enhanced natural resource management across its supply chain. In the fourth quarter of 2025, the Sri Trang Group obtained FSC Forest Management certification. The Company’s rubber plantations totaling 41,303.58 rai, representing 100 percent of its owned plantation area, were certified under FSC Forest Management standards. In addition, 1,934.75 rai of member plantations and 5,235.35 rai of community forest conservation areas were included under the certification scope. This achievement demonstrates the Company’s commitment to responsible business practices across environmental, social, and economic dimensions and reinforces confidence among customers and stakeholders throughout the value chain from upstream to downstream. Social In 2025, the Company continued to enhance employee capabilities while creating shared value for society and surrounding communities under its sustainable growth philosophy, which places people at the center across all dimensions, including employees, business partners, farmers, and communities in its areas of operation.Social The Company advanced its organizational development strategy through the SRI TRANG AI DIRECTION 2025 initiative and communicated its policy direction at the 2025 Sri Trang Town Hall under the theme “Growth of the Infinite Future.” The initiative sets out a systematic approach to integrating artificial intelligence across the organization, particularly in manufacturing operations through an AI Driven Manufacturing framework. These efforts aim to improve operational efficiency, enhance accuracy, and strengthen competitiveness, alongside continuous employee development through upskilling and reskilling programs. In addition, the Company launched the “AI Clinic” project to support the practical adoption of artificial intelligence in work processes and to foster a culture of learning and innovation within the organization. This initiative reflects the Company’s commitment to developing a versatile and adaptable workforce capable of responding effectively to industry transformation. With respect to human rights, the Company is committed to conducting business with respect for internationally recognized human rights principles. The Company participated in the seminar “Integrating Human Rights into Business” to exchange best practices in alignment with the United Nations Guiding Principles on Business and Human Rights. This underscores the Company’s commitment to transparency, fairness, and responsible business conduct throughout its value chain. The Company also places importance on cultivating a positive corporate culture through the “Sri Trang Friendly” program, which promotes service minded attitudes, courteous communication, and a supportive working environment. These principles form an essential foundation for effective collaboration and high quality customer service. In terms of community and social responsibility, during 2025 the Company provided assistance to flood affected communities in southern Thailand by establishing employee support centers, distributing relief packages, providing donations and medical supplies, and deploying volunteer employees to support recovery efforts. The Company also extended assistance to individuals affected by the Thailand Cambodia border situation in three provinces, namely Buriram, Ubon Ratchathani, and Sa Kaeo, through the provision of drinking water, essential supplies, and food to local shelters. These actions reflect the Company’s role as a responsible corporate citizen that grows alongside communities and stands ready to support society in times of crisis. Furthermore, the Group has continued to receive the “Outstanding Organization Supporting Employment of Persons with Disabilities” award for the eighth consecutive year. This recognition reflects the Group’s commitment to promoting equal opportunities, reducing inequality, and empowering persons with disabilities through appropriate employment. The Company’s social initiatives in 2025 therefore extend beyond workforce development to encompass the promotion of human rights, equality, and community value creation, supporting sustainable and resilient long term growth. Governance & Economics In 2025, the Company remained committed to conducting its business in accordance with good corporate governance principles, transparency, and accountability to all stakeholder groups. The Company aims to build confidence among investors, business partners, customers, and society, while strengthening its long term competitiveness. The Company has established governance policies and a structured corporate governance framework, and ensures effective implementation and monitoring through robust risk management, internal control, and internal audit processes. The Company also discloses its operating performance and the performance of the Board of Directors in accordance with both domestic and international disclosure standards and assessment frameworks, including IFRS S1 and IFRS S2, GRI Standards, S and P Global, FTSE Russell, and SET ESG Ratings. The Company has consistently received an “Excellent” or 5 Star rating under the Corporate Governance Report of Thai Listed Companies conducted by the Thai Institute of Directors. STA has received this recognition for seven consecutive years. This reflects strong governance practices, transparent disclosure, and fair treatment of stakeholders. With respect to anti corruption, the Company received the CAC Change Agent Award from the Thai Private Sector Collective Action Against Corruption. This marks the third year of recognition for STA. The award reaffirms the Company’s commitment to transparent business practices and its proactive role in encouraging SME business partners to declare their commitment to anti corruption, thereby elevating governance standards across the supply chain. In terms of international sustainability recognition, the Company has received a Gold rating from EcoVadis for the second consecutive year and ranked among the top 5 percent of companies assessed globally. This reflects the strength of its management systems in environmental performance, labor and human rights, business ethics, and sustainable procurement. At the national level, the Company received the highest “AAA” rating in the SET ESG Ratings 2025 and was honored with the Best Sustainability Awards at the SET Awards 2025, as well as the Sustainability Disclosure Award from Thaipat Institute, demonstrating excellence in transparent and standardized ESG disclosure. In recognition of leadership and capital market confidence, the Company received Outstanding CEO, Outstanding CFO, and Outstanding IR awards in the Agro Industry sector at the IAA Awards 2025. These awards are based on assessments by securities analysts and fund managers and reflect strong confidence in the Company’s management direction, disclosure practices, and ability to deliver sustainable value. In addition, the Company entered into a collaboration agreement with the National Research Council of Thailand to promote research, technology development, and innovation in natural rubber. This initiative is expected to enhance production efficiency, increase product value, and strengthen the long term competitiveness of the Thai rubber industry. The Company’s governance and economic performance in 2025 therefore reflect its commitment to effective, transparent, and responsible management, while maintaining a balance between economic growth, sustainability, and stakeholder confidence. | ||||||||||||||||||||||||||||||||||||||||||||||||||||||||||||||||||||||||||||||||||||||||||||||||||||||||||||||||||||||||||||||||||||||||||||||||||||||||||||||||||||||||||
Debt Securities with Financial Ratio Requirements
Debt Securities with Financial Ratio Requirements Issued?
Yes
Can the Company Maintain the Reported Financial Ratios?
Yes
Explanation
As of 31 December 2025, the Company’s total interest bearing debt, comprising short term and long term loans from financial institutions, debentures, and lease liabilities, amounted to THB 41,780.9 million. Further details regarding maturity profiles, interest rates, and outstanding obligations by currency are disclosed in Note 20 to the Financial Statements. The Company is required to comply with certain financial covenants, specifically key financial ratios, on a quarterly basis as follows:
Ratio | condition | 1Q25 | 2Q25 | 3Q25 | 4Q25 | Result |
Long term loan agreements | ||||||
Net Debt to Equity | Not exceed 3:1 following the financial statement | 0.61 | 0.46 | 0.46 | 0.55 | Complied |
Debentures | ||||||
Net Debt to Equity | Not exceed 3:1 following the financial statement | 0.61 | 0.46 | 0.46 | 0.55 | Complied |
Factors That May Affect Financial Condition
Factors or Incidents That May Materially Affect Financial Condition
Natural Rubber Price Volatility
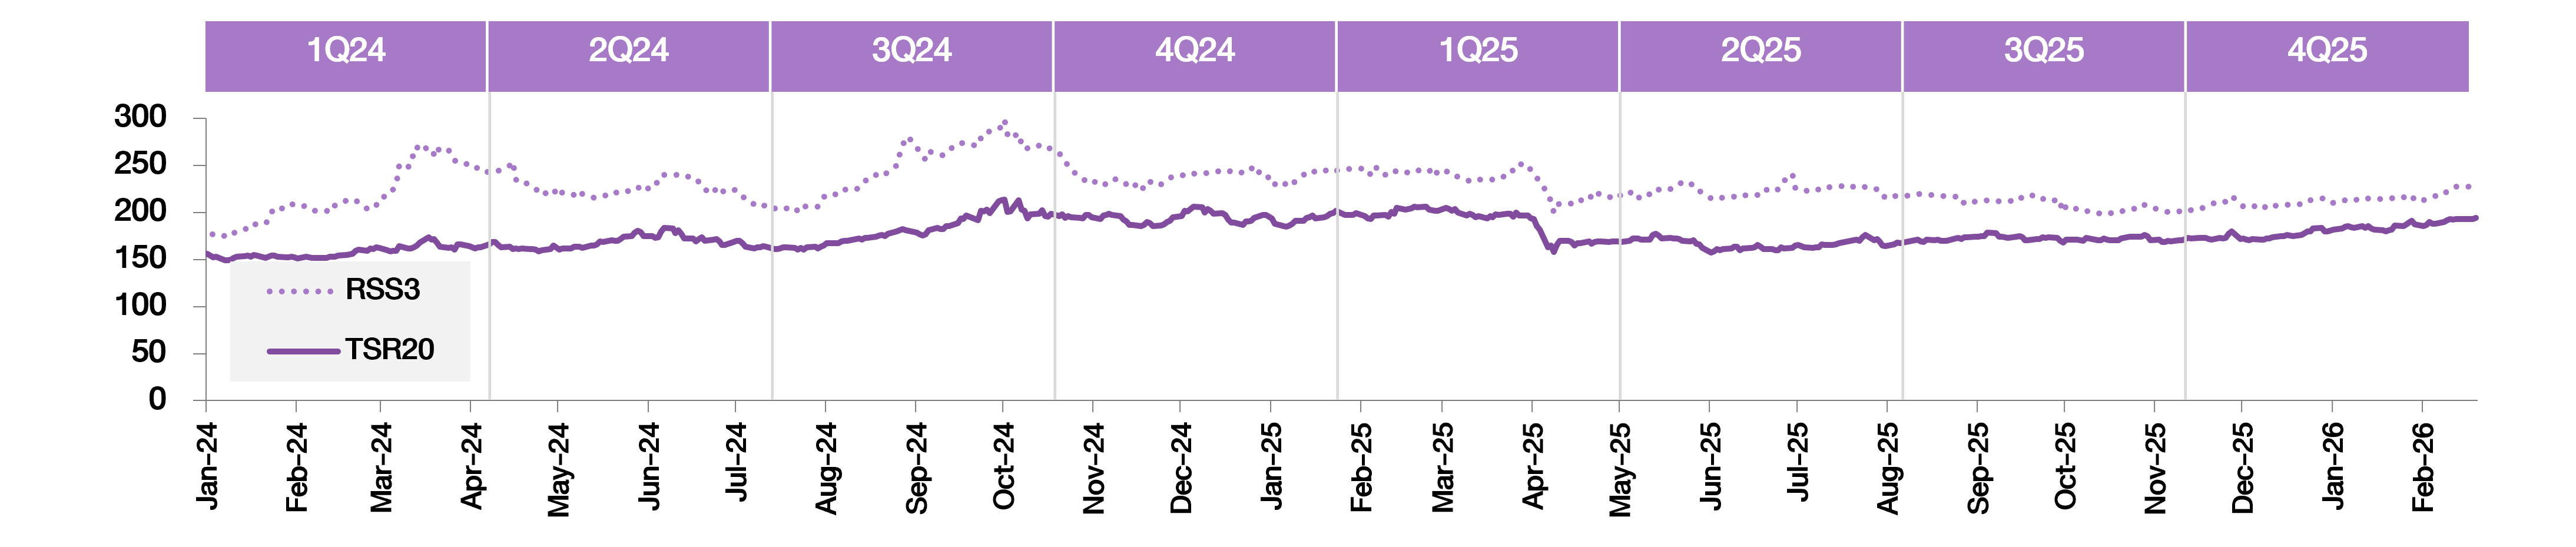
Graph showing TSR20 and RSS3 prices on the Singapore Exchange (SICOM) (US cents/kg)
Natural rubber prices are subject to volatility driven by both supply and demand factors. On the supply side, production trends in each producing country are influenced by weather conditions and other factors, including the prices of alternative crops offering attractive returns, such as palm oil and durian, which may encourage some farmers to shift cultivation. In addition, changes in land use, including urban expansion, infrastructure development, and mining activities in certain areas, may result in a reduction of rubber plantation areas. On the demand side, the tire industry represents the primary consumer of natural rubber globally. Accordingly, the growth of this industry directly affects overall demand for natural rubber.
An imbalance between supply and demand may lead to price uncertainty, which could impact the Company’s operating results. Nevertheless, the Company continuously manages price-related risks through procurement strategies, inventory management, and market diversification to enhance operational flexibility and maintain competitiveness.
In 2025, the announcement of the U.S. Reciprocal Tariff measures in early April led to a sharp short term decline in natural rubber prices, followed by a limited recovery in subsequent periods. This reflects the sensitivity of rubber prices to policy developments and market sentiment. For 2025, the average TSR20 price at the SICOM market was 177.2 cents per kg, representing an increase of 1.7 percent from the previous year.
Table of average reference prices for TSR20 and RSS3 on the Singapore Commodity Exchange (SICOM)
(US cent/kg.) | RSS3 | TSR20 | ||||
2025 | 2024 | Increase /Decrease | 2025 | 2024 | Increase /Decrease | |
Average Price – Q1 | 240.9 | 214.7 | 12.2% | 197.4 | 157.3 | 25.5% |
Average Price – Q2 | 220.4 | 229.9 | 4.1% | 167.9 | 168.3 | 0.2% |
Average Price – Q3 | 218.6 | 238.3 | 8.3% | 170.2 | 175.1 | 2.8% |
Average Price – Q4 | 205.7 | 246.5 | 16.6% | 173.1 | 196.0 | 11.7% |
Yearly Average Price | 221.4 | 232.3 | 4.7% | 177.2 | 174.2 | 1.7% |
Close Price as of 31 Dec | 215.0 | 236.8 | 9.2% | 179.9 | 197.4 | 8.9% |
Foreign Exchange Rate Risk (USD/THB)
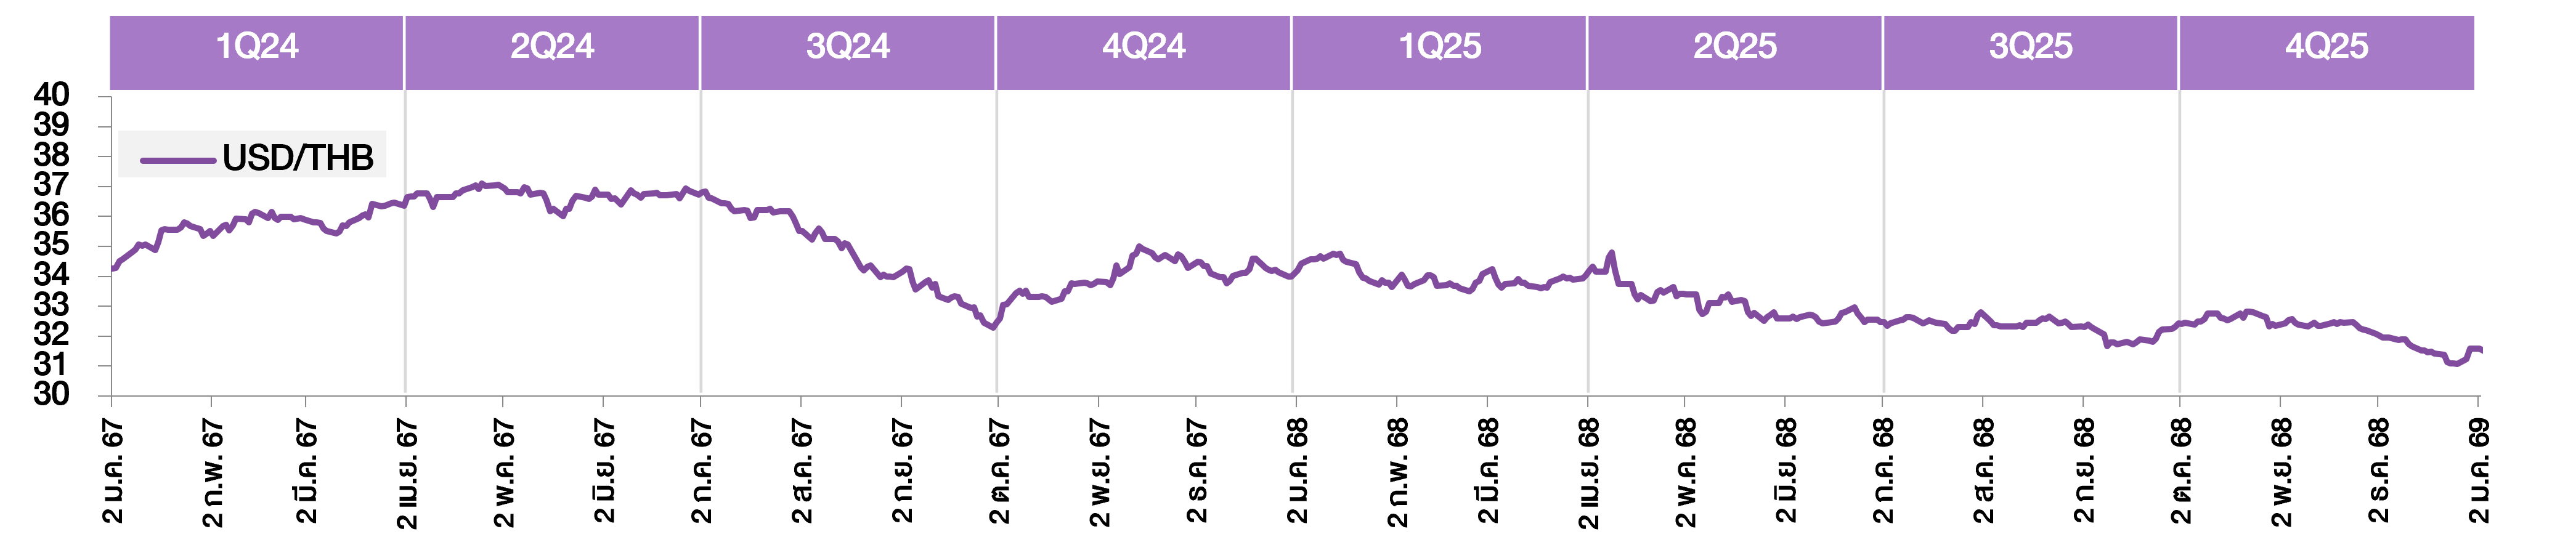
Graph of Exchange Rate Trends: Thai Baht against the US Dollar (THB:USD)
Fluctuations in the exchange rate between the Thai Baht and the U.S. Dollar affect the Company’s revenue, as the majority of its revenue is denominated in U.S. Dollars, accounting for approximately 73.7 percent, while the Company’s financial statements are presented in Thai Baht.
To mitigate foreign exchange risk, the Company enters into financial derivative instruments to reduce exposure to currency volatility arising from foreign currency denominated revenue. In addition, the Company applies hedge accounting in accordance with relevant accounting standards to ensure that its financial statements appropriately reflect its risk management practices.
Government Policies
Policies of the Thai government and those of major natural rubber exporting countries may have either positive or negative impacts on the Company’s operations. For example, supply intervention measures undertaken by governments of major natural rubber producing countries through export reduction programs were first implemented in 2012, followed by measures in 2016 and 2018, and most recently in 2019. These actions were carried out pursuant to resolutions of the International Tripartite Rubber Council, whereby member countries comprising Thailand, Indonesia, and Malaysia agreed to reduce export volumes of natural rubber and increase domestic consumption. However, such policies may result in domestic natural rubber prices moving inconsistently with global market prices or may give rise to speculative activities in the futures market.
However, the Thai government has implemented policies aimed at addressing the issue of low rubber prices and supporting rubber farmers without distorting market mechanisms, such as the Rubber Farmer Income Guarantee Program implemented during October 2021 to March 2022, October 2022 to November 2022, and January to September 2023. Under the program, the guaranteed prices were set at THB 60 per kilogram for unsmoked rubber sheets, THB 57 per kilogram for fresh latex, and THB 23 per kilogram for cup lump, with the government compensating farmers for the difference between the guaranteed price and the reference market price. In parallel, the government has also introduced longer term measures to stimulate rubber consumption, including credit support for natural rubber processors, under which government agencies provide interest subsidies of up to 3.0 percent to participating operators, with a subsidiary of the Company participating in this program, as well as the promotion of sustainable rubber plantation management in accordance with Forest Stewardship Council (FSC) standards to enhance the value of Thai natural rubber products and expand export market opportunities.
As of 2025, no income guarantee scheme has been implemented. However, any future policy measures may affect the Company’s operating performance.
EU Deforestation-free Products Regulation (EUDR)
The European Union has enacted the EU Deforestation free Products Regulation, which requires seven commodities comprising cattle, cocoa, coffee, palm oil, soy, wood, and natural rubber, including derived products, to undergo due diligence and traceability reporting to ensure that they are not associated with deforestation.
Following its announcement, the European Union has postponed the enforcement of the regulation twice. Most recently, the implementation timeline was extended by an additional year, resulting in a total of 2 postponements. The regulation is now scheduled to take effect on 30 December 2026 for the Company and other large operators, however, for small and medium sized enterprises will take effect on 30 June 2027.
The Company continues to closely monitor developments relating to this regulation and to assess potential impacts on exports of natural rubber and related products to the European Union market. Although EUDR may pose constraints for operators that are not adequately prepared in terms of traceability, the Sri Trang Group views this development as an opportunity to elevate supply chain standards. The Company has developed the “Sri Trang Friends” platform to enhance transparency in raw material traceability and works closely with customers and relevant government authorities to ensure efficient and effective compliance with the regulatory requirements.
International Tax Reform (Pillar Two)
The Organization for Economic Co-operation and Development has introduced the Global Minimum Tax at a rate of
15 percent under the Pillar Two framework. The rules apply to multinational enterprise groups with consolidated annual revenue exceeding 750 million euros and are intended to prevent profit shifting to low tax jurisdictions and reduce harmful tax competition among countries.
The Group falls within the scope of the Pillar Two Model Rules and has applied the relevant accounting guidance which provides a temporary exception from the recognition and disclosure of deferred tax assets and liabilities related to Pillar Two. The Group operates in multiple jurisdictions that have enacted domestic legislation to implement Pillar Two and where such legislation has become effective.
During 2025, the Group assessed the impact of the implementation of the Pillar Two legislation and recognized additional tax expenses expected to arise under the Global Minimum Tax rules in respect of a subsidiary operating in Singapore. Such amount has been presented as part of income tax expense in the statement of profit or loss. However, the extent of the impact depends on various factors, including revenue structure, profit allocation across jurisdictions, and applicable tax incentives in each tax jurisdiction.
Management continues to closely monitor regulatory developments and carefully evaluate appropriate measures to manage potential impacts going forward.
Geopolitical & Trade Risk
Geopolitical tensions and changes in international trade policies, including the Reciprocal Tariff measures announced by the United States in 2025, could have implications for global trade flows, market sentiment, and competitive dynamics across various industries, including the natural rubber industry. The magnitude and duration of such impacts remain subject to uncertainty and may vary depending on product categories, destination markets, and the specific scope and timing of the measures implemented.
The Company continues to closely monitor geopolitical developments and evolving trade policies and seeks to manage associated risks through export market diversification, maintaining relationships with customers across multiple regions, and prudent cost management. These efforts are intended to enhance operational resilience and flexibility in an environment characterized by elevated uncertainty.
In addition, the Company has analyzed and assessed risks, opportunities, and potential business and financial impacts related to climate change. These include physical risks, such as flooding, drought, and extreme rainfall, as well as transition risks arising from regulatory, market, and technological changes associated with the transition to a low carbon economy. The Company has also developed mitigation and risk reduction plans to address such impacts.
Further details on the analysis and assessment of climate related risks, opportunities, and impacts are disclosed in Part 1 Business Operations and Performance under the Risk Management section of this report, as well as in the Company’s Sustainability Report under the Emerging Risks section.